RWI/ISL Container Throughput Index

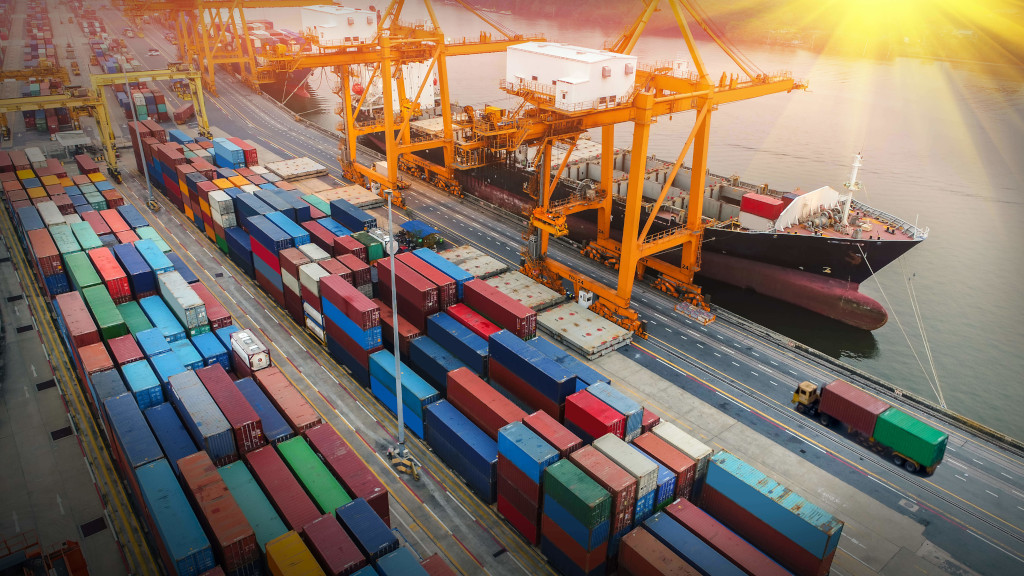
Since early 2012, the Institute of Shipping Economics and Logistics (ISL) and the RWI – Leibniz-Institut für Wirtschaftsforschung (RWI) are publishing a monthly index for global container throughput which aims to provide reliable conclusions on short term trends in worldwide economic activity. The RWI/ISL Container Throughput Index uses the fact that international trade is primarily handled by ships and containers, which means the container throughput in ports is an important indicator of global trade. Currently, the database consists of 82 international ports covering more than 60% of world container handling. These ports are continuously monitored by the ISL as part of their market analysis.

February 2023 RWI/ISL Container Throughput Input Index: Strong downturn in Europe
January 2023 RWI/ISL Container Throughput Input Index: Weak start to the new year
December 2022 RWI/ISL Container Throughput Index: Revival of container throughput reaches Europe
November 2022 RWI/ISL Container Throughput Index: Container throughput remains weakened
October 2022 RWI/ISL Container Throughput Index: Sharp decline in container throughput indicates a weak phase in the global economy
September 2022 RWI/ISL Container Throughput Index: Global trade remains stable despite economic troubles
August 2022 RWI/ISL Container Throughput Index: Increasing Container Throughput indicates Easing of Tension of disturbed Supply Chains
July 2022 RWI/ISL Container Throughput Index: Container throughput stagnates
June 2022 RWI/ISL Container Throughput Index: China continues to stimulate Global Trade
May 2022 RWI/ISL Container Throughput Index: Recovery of container throughput in spite of continously disturbed supply chains
April 2022 RWI/ISL Container Throughput Index: Significant Recession of Container Throughput in Chinese Ports
March 2022 RWI/ISL Container Throughput Index: World trade remains subdued
February 2022 RWI/ISL Container Throughput Index: Strong dampener for world trade
January 2022 RWI/ISL Container Throughput Index: World trade returns to growth path
December 2021 RWI/ISL Container Throughput Index: New strains on world trade loom in Chinese ports
November 2021 RWI/ISL- Container Throughput Index: Again strong impulses for the international container trade from China
October 2021 RWI/ISL-Container Throughput Index: Recovery in China Carries International Container Trade
September 2021 RWI/ISL Container Troughput Indes: Slight recovery with strong regional disparities
August 2021 RWI/ISL Container Throughput Index: Increasing container handlings in China lead stimulate international container trade
July 2021 RWI/ISL Container Throughput Index: Problems in China dampen international container traffic
June 2021 RWI/ISL-Container Throughput Index: Upturn in Europe allows for container handling increase
May 2021 RWI/ISL-Container Throughput Index: Sharp increase in container throughput continues
April 2021 RWI/ISL-Container Throughput Index: Upturn in Europe allows for container throughput rise
March 2021 RWI/ISL Container Throughput Index: lockdown dampens container handling in Europe
February 2021 RWI/ISL Container Throughput Index: World trade remains stable despite lockdown in Europe
January 2021 RWI/ISL Container Throughput Index: World trade returns to growth path
December 2020 RWI / ISL container throughput index: Slight Weakening of World Trade
November 2020 RWI / ISL container throughput index: World trade recovery is weakening
October 2020 RWI/ISL Container Throughput Index: Strong increase in October
September 2020 RWI/ISL Container Throughput Index: World trade grows strongly, Index reaches all-time high
August 2020 RWI/ISL container handling index: World trade is reviving on a wide range
July 2020 RWI/ISL Container Throughput Index: Revival of world trade continues
June 2020 RWI/ISL Container Throughput Index: World trade is catching up again - regional differences remain large
May 2020 RWI/ISL Container Throughput Index: The decline continues slower
April 2020 RWI/ISL Container Throughput Index: 6.5 percent below previous year's value
March 2020 RWI/ISL Container Throughput Index: normalization in China, further decline in the rest of the world
February 2020 RWI/ISL Container Throughput Index: sharp drop in February
January 2020 RWI / ISL Container Throughput Index: Surprising increase in January - but narrow database
Dezember 2019 RWI/ISL-Containerumschlag-Index: Handelskonflikte belasten Welthandel zunehmend
November 2019 RWI/ISL Container Throughput Index: trade conflicts impact on world trade
October 2019 RWI/ISL Container Handling Index: World trade returns to growth
September 2019 RWI / ISL Container Throughput Index: Despite a new high in the underlying trend rather sideways
August 2019 RWI / ISL Container Throughput Index: Slight increase to new peak value
July 2019 RWI / ISL Container Throughput Index: Peak value despite trade conflict
 
June 2019 RWI/ISL Container Handling Index: Stagnating world trade
 
May 2019 RWI/ISL Container Throughput Index: World trade despite trade conflicts with upward trend
 
April 2019 RWI/ISL Container Throughput Index: world trade in the red again
 
March 2019 RWI/ISL Container Throughput Index: world trade recovering slightly
 
February 2019 RWI/ISL Container Throughput Index: World trade declines considerably
 
January 2019 RWI/ISL-Container Throughput Index World remains at high level
 
December 2018 RWI/ISL-Container Throughput Index: World trade seems to defy protectionist measures so far
 
October 2018 RWI/ISL-Container Throughput Index indicating world trade revival
 
September 2018 The RWI/ISL-Container Throughput Index has been decreasing two months in a row.
 
August 2018 RWI/ISL-Container Throughput Index indicates that world trade is stuck at current levels
 
July 2018 RWI/ISL- Container Throughput Index: World Trade stagnates since the beginning of the year
 
June 2018 RWI/ISL-Container Throughput Index receding slightly
 
May 2018 RWI/ISL Container Throughput Index still showing upwards
 
April 2018 Index recovers slightly after March
 
March 2018 Index with clear downward movement on a high level
 
February 2018 Index with minor decline on a high overall level
 
January 2018 Index started off well in 2018
 
December 2017 Index ending 2017 on a positive note
 
November 2017 New all-time high after October dip
 
October 2017 RWI/ISL-Container Throughput Index: No trend reversal yet despite decline
 
September 2017 RWI/ISL-Container Throughput Index reaches new heights
 
August 2017 Index still pointing upwards
 
July 2017 Index still pointing upwards
 
June 2017 Index remains upbeat
 
May 2017 Index still pointing upwards
 
April 2017 Index drops after all-time high recorded in March
 
March 2017 Index continues to rise strongly
 
February 2017 Index remains upbeat
 
January 2017 Index suggests world trade expansion weakness might be over
 
December 2016 Index hitting all-time-high at the end of 2016
 
November 2016 Index painting a more benign picture of world trade this month
 
October 2016 Index at a standstill
 
September 2016 Index improves slightly
 
August 2016 World trade suffered a setback in August
 
July 2016 Increase of world trade continues
 
June 2016 World trade showing signs of improvement
 
May 2016 Global Trade declining further
 
April 2016 Global Trade relapses into Stagnation
 
March 2016 Unclear tendencies of world trade
 
February 2016 World trade back in the doldrums?
 
January 2016 World trade expanding for the fourth month in a row
 
December 2015 World trade continues to improve
 
November 2015 Growing evidence of stronger world trade
 
October 2015 World trade gradually increasing
 
September 2015 World trade stuck in reverse gear
 
August 2015 World trade continues to contract
 
July 2015 world trade remains sluggish
 
June 2015 Continues to fall slightly in June
 
May 2015 Setback for World Trade
 
April 2015 Moderate growth of world trade continues
 
March 2015 Small but steady world trade growth
 
February 2015 World trade development lacking direction
 
January 2015 Growth of world trade continues to slow down
 
December 2014 Container Throughput Index decreased significantly
 
November 2014 World trade remains at high level
 
October 2014 World Trade Growing Again
 
September 2014 Slight decrease
 
August 2014 Unclear development of global trade continues
 
July 2014 Global trade without clear tendency
 
June 2014 World trade more active again
 
May 2014 World trade weakening
 
April 2014 Upward trend in global trade continues
 
March 2014 Global trade indicator points upwards
 
February 2014 World trade strong despite drop in February
 
January 2014 World trade continues to grow
 
December 2013 Growth accelerates
 
November 2013 Ongoing upward trend in world trade
 
October 2013 Signs of world trade upturn
 
September 2013 World trade still without zest
 
August 2013 No signs of a world trade upswing
 
July 2013 Weak expansion of world trade continues
 
June 2013 RWI/ISL Container Throughput Index down again in June
 
May 2013 RWI/ISL Container Throughput Index increased in May
 
April 2013 RWI/ISL Container Throughput Index down in April
 
March 2013 RWI/ISL Container Throughput Index improves slightly in March
 
February 2013 RWI/ISL Container Throughput Index slightly down in February as expected
 
January 2013 RWI/ISL Container Throughput Index - Upswing continued in January
 
December 2012 RWI/ISL Container Throughput Index indicates strengthening world trade towards the end of the year
 
November 2012 RWI/ISL Container Throughput Index stagnates in November
 
October 2012 RWI/ISL Container Throughput Index falls again in October
 
September 2012 RWI/ISL Container Throughput Index shows notable increase in September
 
August 2012 RWI/ISL Container Throughput Index Down in August for the Third Time in a Row
 
July 2012 RWI/ISL Container Throughput Index has fallen again in July
 
June 2012 RWI/ISL Container Throughput Index slightly down in June
 
May 2012 RWI/ISL Container Throughput Index recovers from April low
 
April 2012 RWI/ISL Container Throughput Index has decreased slightly in April
 
March 2012 RWI/ISL Container Throughput Index increased markedly in March
 
February 2012 Further growth of global economic activity in February
 
January 2012 New RWI/ISL Container Throughput Index: Global economic activity is livening up
 
Calculating the RWI/ISL Container Throughput Index

Calculating the indicator starts about 20 days after the end of each month. At that time, about 25 ports have already published information about the container throughput in the latest months, which allows for a flash estimate of the indicator. Data still missing are forecasted using statistical time series models. Thereafter, the data are added up and the sum is adjusted for seasonal and calendar effects. Furthermore, the trend-cycle component of the seasonally adjusted figures is estimated to eliminate irregular influences. One month later, as a rule data on 65 ports are available. Then an update of the figures already published is made and a new flash estimate for the latest month is released.

To form the index, the container throughput of the considered ports is initially added. Missing monthly data are forecasted using statistical methods. Then a first provisional index is derived from the result, which uses the year 2008 as a base and therefore assumes the value 100. The actual Container Throughput Index is then derived out of this row by adjusting seasonal influences and calendar effects. In addition to the seasonally adjusted value, the smoother trend-cycle component of the index is published, which is less sensitive to temporary distortions. An example of such a temporary factor is the Chinese New Year, which drops the handling in the major Chinese ports for container traffic to a minimum.

Calculations since 2007 show that the Container Throughput Index is very closely correlated with the data on world trade, which are published by the International Monetary Fund (IMF). In particular, during the financial and economic crisis in 2008/2009, the index provided reliable data. As the German economy is heavily export-oriented, the assessment of the international economy is an essential basis for analysis. Against this background, the RWI/ISL Container Throughput Index helps to forecast the German economy effectively.
Ports of the RWI/ISL Container Throughput Index
Port Country
Cape Town South Africa
Casablanca Morocco
Durban South Africa
Ngqura South Africa
Tanger Med Morocco
Port Country
Balboa Panama
Buenaventura Colombia
Buenos Aires Argentina
Callao Peru
Charleston USA
Guayaquil Ecuador
Houston USA
Itajai Brazil
Kingston JaMayca
Lazaro Cardenas Mexico
Long Beach USA
Los Angeles USA
Manzanillo Mexico
Manzanillo Panama
Montevideo Uruguay
Montreal Canada
New York/New Jersey USA
Oakland USA
Paranagua Brazil
Port of Virginia USA
San Antonio Chile
Santos Brazil
Savannah USA
Tacoma/Seattle USA
Valparaiso Chile
Vancouver Canada
Veracruz Mexico
Port Country
Aden Yemen
Ashdod Israel
Bangkok Thailand
Beirut Lebanon
Busan South Korea
Colombo Sri Lanka
Dammam Saudi Arabia
Guangzhou China
Haifa Israel
Hong Kong China
Inchon South Korea
Jeddah Saudi Arabia
Kaohsiung Taiwan
Keelung Taiwan
Kobe Japan
Kwangyang South Korea
Laem Chabang Thailand
Mersin Turkey
Nagoya Japan
Nhava Sheva India
Ningbo China
Osaka Japan
Qingdao China
Shanghai China
Shenzhen China
Singapore Singapore
Taichung Taiwan
Tianjin China
Tokyo Japan
Xiamen China
Yokohama Japan
Port Country
Algeciras - La Linea Spain
Ambarli Turkey
Barcelona Spain
Bremen/Bremerhaven Germany
Dublin Ireland
Gdansk Poland
Genoa Italy
Hamburg Germany
Helsinki Finland
Klaipeda Lithuania
Kotka Finland
Lisbon Portugal
St. Petersburg Russia
Tallinn Estonia
Valencia Spain
Zeebrugge Belgium
Port Country
Brisbane Australia
Melbourne Australia
Sydney Australia

You will find details of individual ports in our Monthly Container Port Monitor