Global trade is back on course for growth
At the start of 2024, the world merchant fleet consisted of 61,811 vessels with a combined capacity of 2.25 billion dwt, after a year-on-year increase of 3.6 %. (Ships of 300 gt and over). The fleet additions reached the level of the start of this decade with 1,578 merchant vessels with a combined 84 million dwt were reported delivered in 2023. This is equal to a rise of 5.3 % year-on-year in dwt terms. In the same period, just 347 merchant vessels with a combined capacity of 9.4 million dwt have been reported sold for scrap, representing a 15 % year-on-year decrease.
Clarkson's Seaborne Trade Monitor expects seaborne trade to grow by 3 % in 2023 after a decline of just under half a percent a year earlier. The experts are also forecasting growth for 2024, although at an estimated 2.1 % it will be slightly lower. However, a closer look at the figures reveals that the container trade in particular has probably not provided a significant contribution to growth in 2023. In addition to the economic crisis, particularly in Europe and Asia, political and environmental developments also come into focus here. The decision by the major container shipping companies to no longer use the Suez Canal for Europe-Asia traffic due to the military conflicts in the Middle East and the attacks by Houthi rebels on civilian shipping will have an impact on maritime trade, at least in the short term. The voyage, especially for container freighters, is therefore at least 7 days longer per trip on the Asia-Europe route, as the only alternative now is to use the longer route around the Cape of Good Hope.
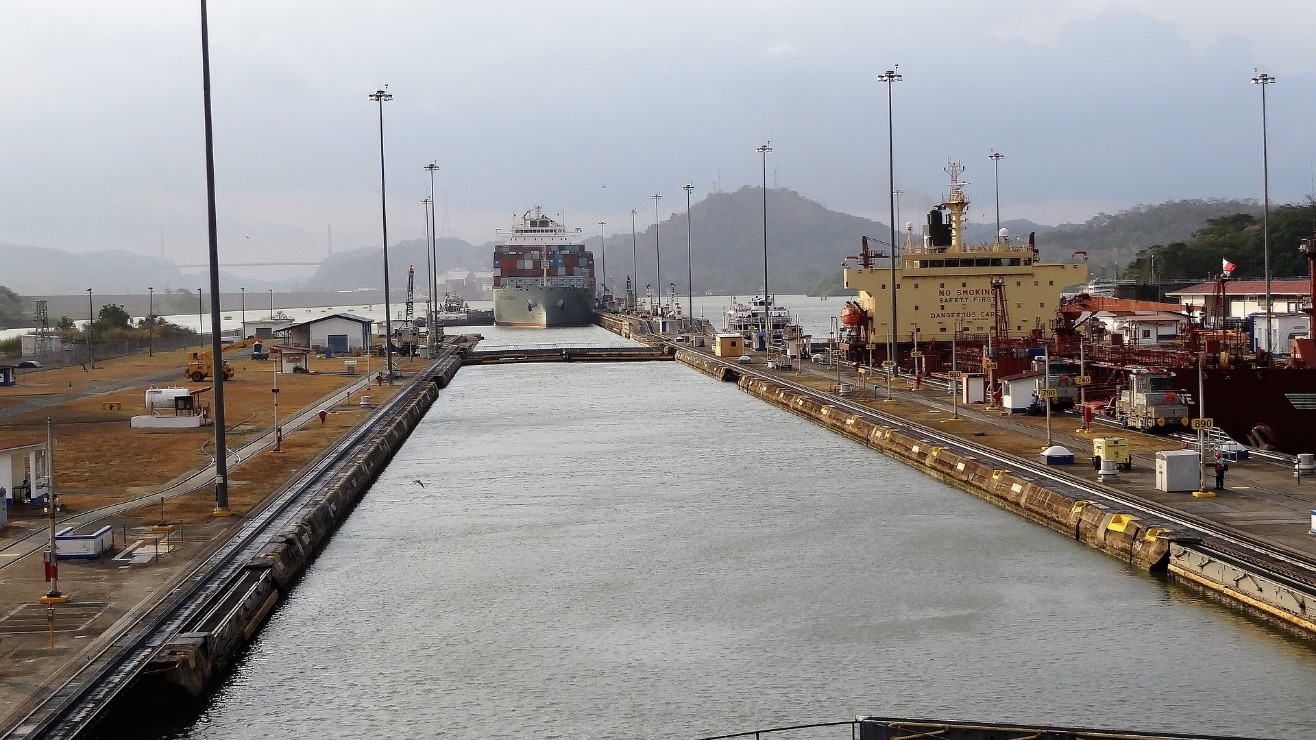
However, there are also considerable logistical problems on the other side of the Atlantic Ocean, as the Panama Canal Commission does not have enough fresh water available to lock the large ships on their way through the Panama Canal and has therefore had to reduce the number of passages and limit the maximum draught of ships using the canal.
As the transportation of liquid and dry bulk goods in most cases does not go through this bottleneck, it is virtually unaffected here. This is one of the reasons why the above-mentioned growth in maritime trade is driven in particular by dry bulk goods such as iron ore (+4.2 %), coal (+6.6 %) and grain (+4.1 %). Together with the transportation of crude oil and oil products, these three types of goods account for just over 50 % of world seaborne trade.
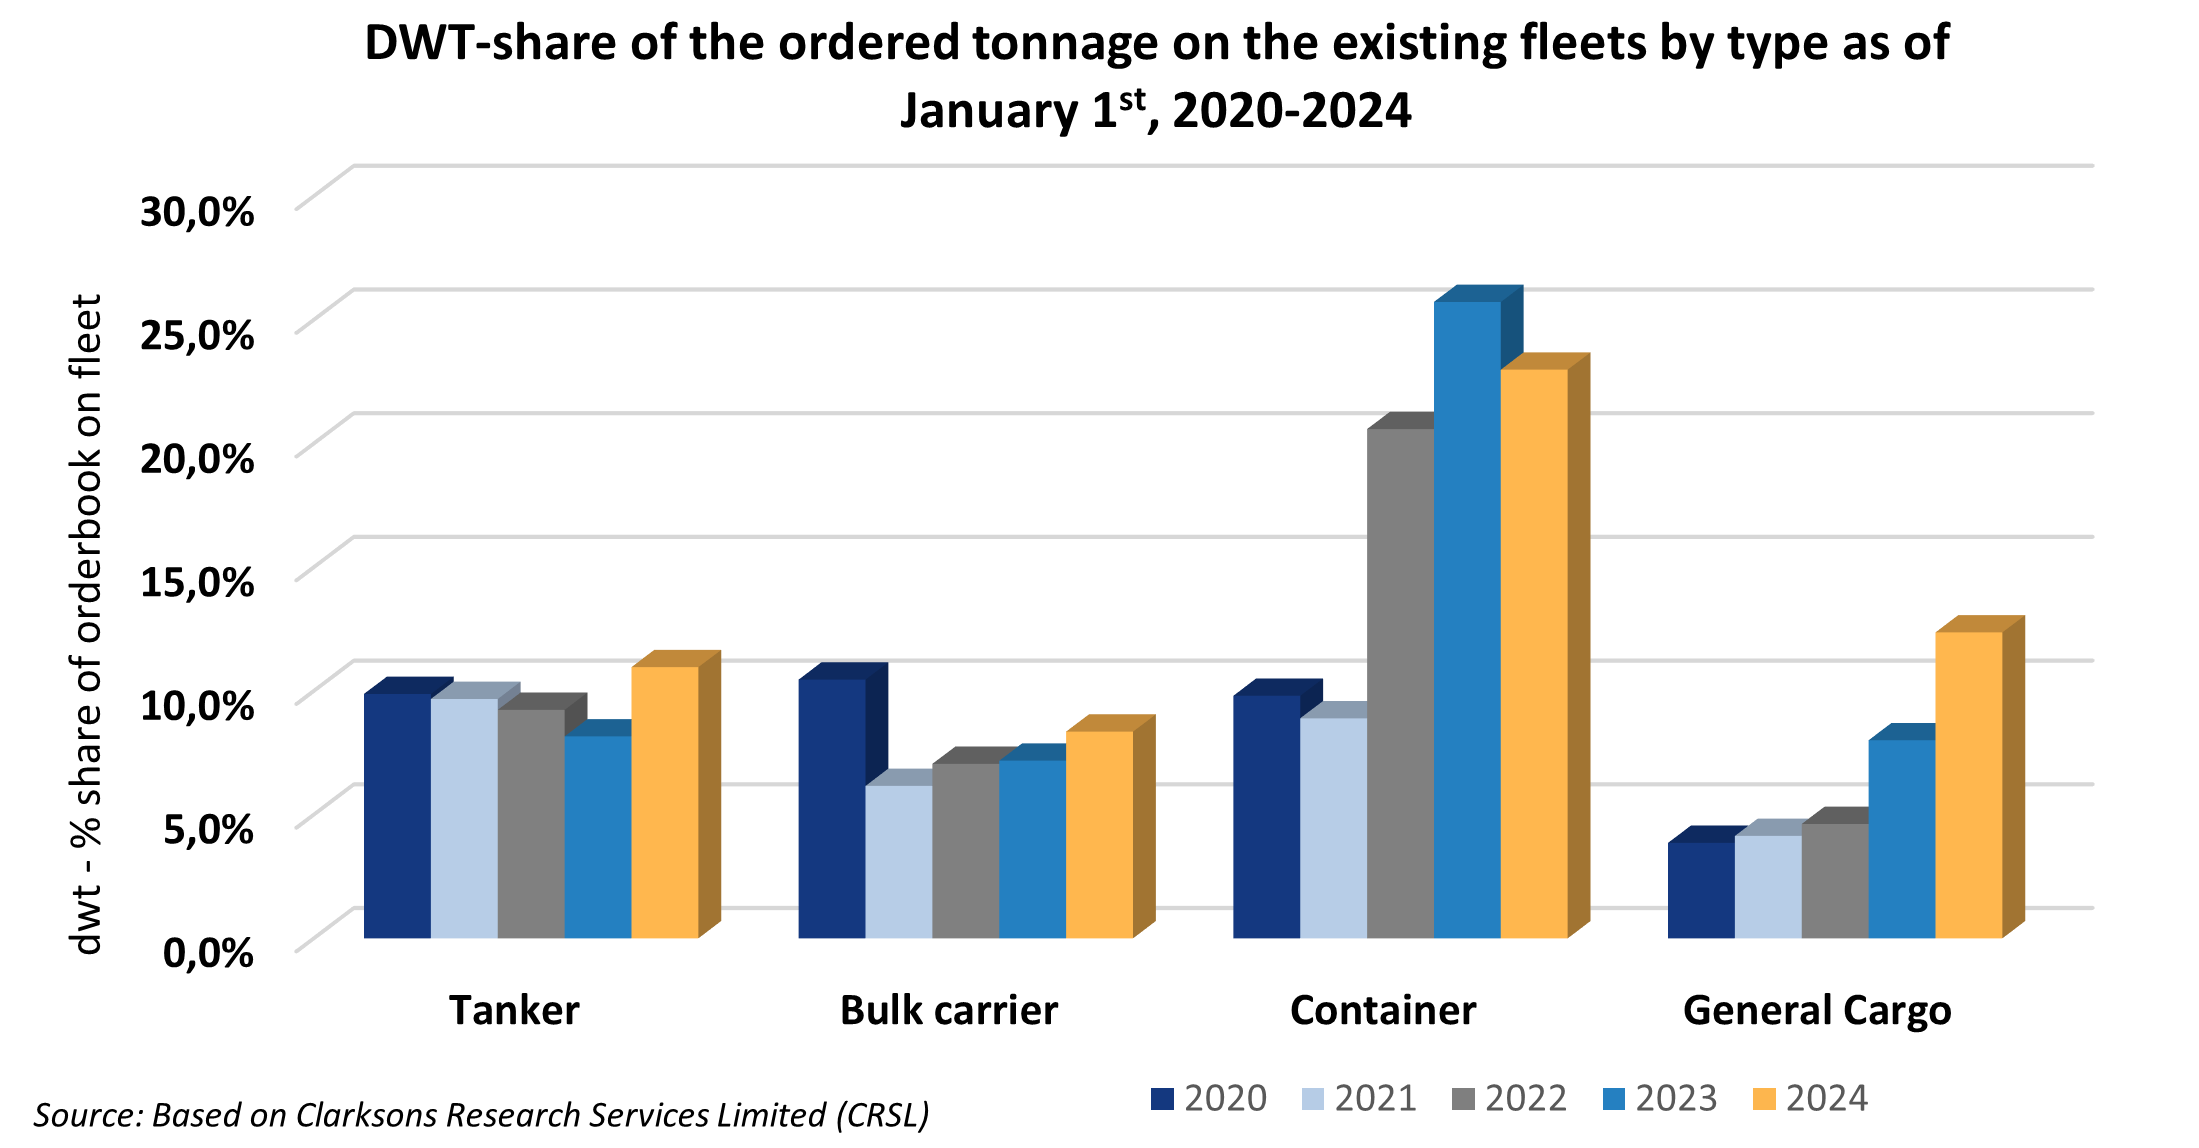
The boom in the LNG, container and car carrier sectors, with rising charter and freight revenues, was reflected in newbuilding orders in 2021 and 2022. The orderbook to fleet ratio in cgt terms is remarkably high for LNG carriers (46%), container ships (22%) and car carriers (20%), while the figures for oil tankers (4%) and bulk carriers (7%) are at historic lows.
The facts outlined above and many more details about world seaborne trade and the development of the world merchant fleet in the current issue of our SSMR.
Further Information
ISL Webshop: order current SSMR issue
The facts outlined above and many more details about the world maritime trade and the development of the ports involved can be found in the current issue of our SSMR.
The special feature topics of each SSMR issue are:
- Issue 1: World Merchant Fleet
- Issue 2: Tanker Market
- Issue 3: Bulk Carrier Market
- Issue 4: Container Shipping
- Issue 5: General Cargo and Container Shipping
- Issue 6: Passenger and Cruise Shipping
- Issue 7: Shipbuilding and Shipbuilders
- Issue 8: Major Shipping Nations
- Issue 9: World Seaborne Trade and World Port Traffic